To our eye the stars appear like tiny points of light. And yet, this starlight has a big story to tell. Aimed with a special tool to decode the light of a star, we can learn all about its chemical makeup, temperature, motion and sometimes even find out that what appears to be one star is in fact a multiple star system. The name of this tool is spectroscopy!
Widely utilized by astronomers, physicists and chemists today, spectroscopy studies the interaction between light and matter. This study goes back to Isaac Newton’s 1666 experiments of splitting the light passing through a prism into separate colour. Although at the time the true nature of the phenomenon was not understood, Newton showed that a prism does not create colors, but only reveals the colours the white light is made of.
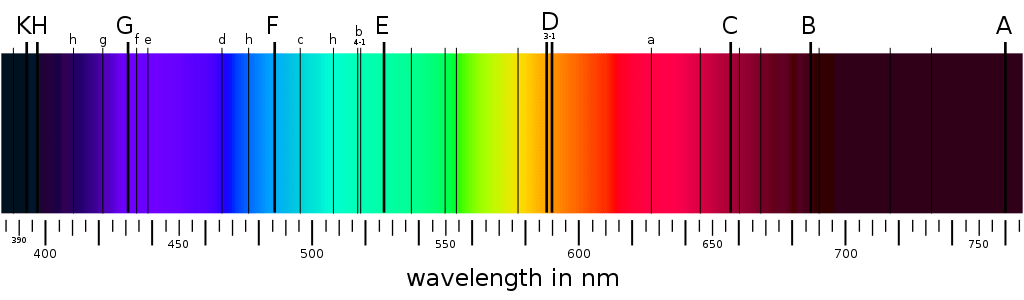
Many scientists contributed to what we now call spectroscopy. Notable figures include Fraunhofer, the scientist who is credited with the invention of the first light splitting-and-measuring device called spectrometer. When Fraunhofer used his spectrometer to study the sunlight, he noticed something bizarre. The Sun did not give a smooth continuous rainbow of colours, but a rainbow with lots of dark lines, as if some of the colours were missing! In his lifetime Fraunhofer observed and catalogued over 500 of these Fraunhofer lines and yet he could not explain their origin.
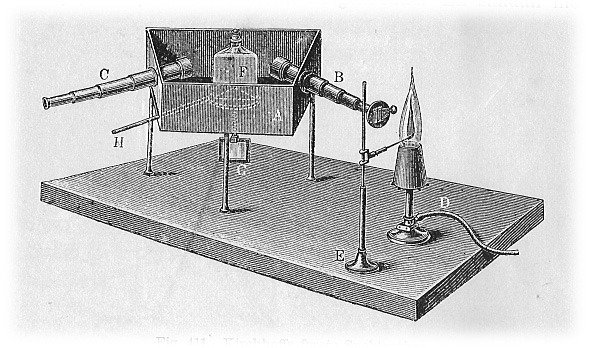
Image: Kirchhoffs first spectroscope
The mystery of the Fraunhofer lines was cracked almost half a century later by Robert Bunsen (yes, as in Bunsen burner) and Gustav Kirchhoff. The two scientists were experimenting with burning minerals in a Bunsen burner and noticed that different elements produce different colour flame. Bunsen and Kirchoff concluded that every element has its own colour, or spectral pattern. Moreover, they were able to identify some of these patterns in the mysterious Solar lines catalogued by Fraunhofer. The study of the solar – and, by extent, stellar – spectroscopy was born!
Explanation
Today we know that Fraunhofer lines – and we have catalogued over 10 000 of them – are caused by the atoms in the Sun’s atmosphere. When the sunlight travels through the atmosphere of our star, these atoms absorb the light of specific* wavelengths creating ‘gaps’ (i.e. dark ABSORPTION lines) in the certain element-specific parts of the Sun’s rainbow.
* This has to do with the electron energy levels that are unique for each atom in the Periodic Table. The electrons can travel between these levels if they gain (absorb) or lose (emit) specific amounts of energy. Than is photons of certain wavelengths!
By learning which combination of absorption patterns belong to which element, we can decode the light coming from stars and other objects in space!
But what exactly can we learn about a star by turning its light into a rainbow?
Quite a few things, such as the star’s…
✅ composition
Every element has its one unique spectral pattern. By comparing the observed absorption lines in a star’s spectrum with the lines of different elements, we can determine chemical make-up of different stars (and sometimes even the atmospheres of their exoplanets)!
✅ temperature
To estimate the surface temperature of a star we need to look at the rainbow, or continuous spectrum, it produces. Even though a star’s rainbow contains all the colours, not every colour has the same intensity. The position of the peak – the colour with the highest intensity- gives us the star’s surface temperature.
The absorption lines can help us estimate the temperature too. Both presence and strength of the lines of different elements indicates hotter or cooler stars. For example, hot stars have strong Hydrogen lines in their spectra. While cool star have strong lines of Calcium and Sodium.
✅ how fast a star is moving towards or away from us and how fasts it is rotating
How can you possibly tell in which direction (along the line of sight) and how fast a star is moving? Spectroscopy to the rescue! It turns out that all the absorption lines in a moving star’s spectrum will appear shifted [compared to the spectrum from a non-moving star] by the same amount! If the shift is towards the higher-frequency end (blue-shift), the star is moving towards us. On the other hand, the shift towards the lower-frequency end (red-shift) indicates that a star is moving away from us. In a similar way we can analyze a star’s rotation!
More information?
If you have any questions or comments, please let our Star Dome team know in the comments below. To find out more about our Portable Planetarium go to http://wonderdome.co.uk.